What is Chart junk?
2023-10-17 03:13:43
What is Chart junk?
Chart junk is unnecessary or confusing parts of a chart's visualization. Chart junk can be images, colors, lines, or text irrelevant to the main data. or that does not help readers understand the information better
Example of Chart Junk
* Unnecessary or excessive gridlines
* Shadows or effects that give the chart a mysterious look.
* Symbols or images that are not related to the data
* Dashed lines or dotted lines that make the chart look chaotic.
* Layers or backgrounds that are not clear
* Unnecessary trademarks or logos
How to Prevent Chart Junk
* Select the chart type that best suits the data.
* Choose different colors
* Choose the appropriate size and shape of the symbol.
* Choose the clear position and size of the letters.
* Use grid lines, shadows, effects, dotted lines, dot lines, layers, backgrounds, trademarks, and logos when necessary.
* Compare charts with original data.
An example of a garbage-free chart is a chart that displays data. There are no unnecessary or confusing parts. and has a design that is appropriate to the data
For example, in the article titled (Draft) the National Waste Management Action Plan (2022-2027), a chart shows the amount of municipal solid waste in 2020, using a pie chart to show the proportion of waste by type. There is no garbage in this chart because
* Use chart types that are appropriate for the data.
* Use different colors
* Use clear letters
* Do not use grid lines, shadows, effects, layers, backgrounds, trademarks, logos, etc.
Example of a garbage-free chart

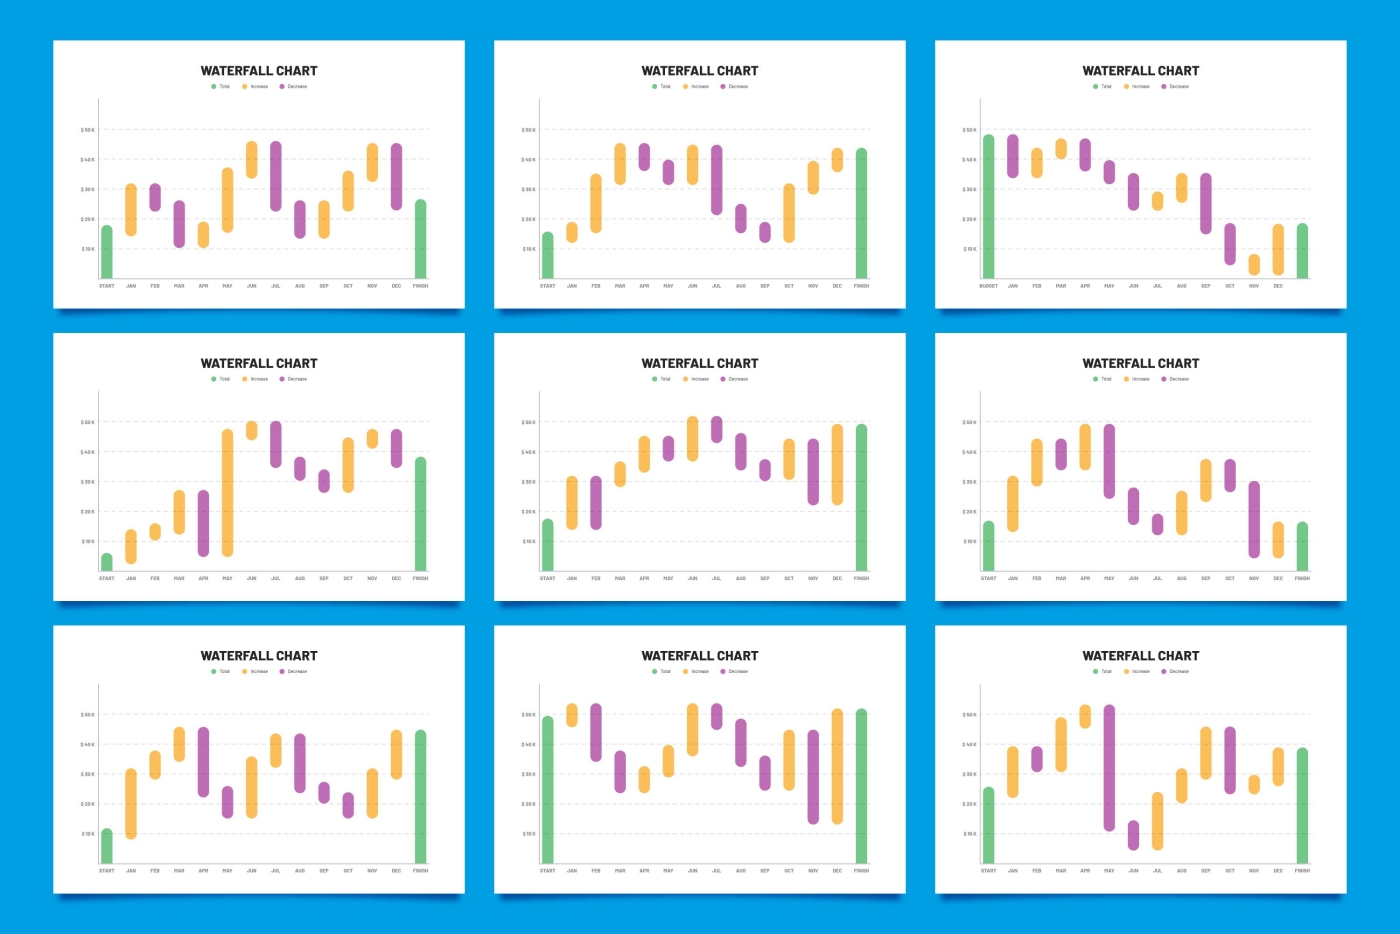
Example of a chart with garbage
Junk charts use images, dotted lines, layers, backgrounds, etc. to add beauty. However, it does not help readers understand the information better.
refer
Chartjunk. (2023, October 9). Retrieved from https://en.wikipedia.org/wiki/Chartjunk.
Leave a comment :
Recent post

2025-01-10 10:12:01

2024-05-31 03:06:49

2024-05-28 03:09:25
Tagscloud
Other interesting articles
There are many other interesting articles, try selecting them from below.

2025-01-24 01:16:31

2024-01-23 02:08:13

2025-04-18 06:57:56

2024-03-22 03:12:18

2023-10-12 04:17:28

2024-03-15 02:24:37

2025-02-10 03:09:32

2024-03-15 09:32:17

